Exploratory Data Analysis
Visualization
We will demonstrate several interesting plots.
Team-Level: Team Points vs Opponent Points

We explored how team offense and defense were related to conference standings. Some highly ranked teams are strong both offensively and defensively (e.g. TOR), while some teams make up for their weaker offense through strong defense (e.g. IND).
Team-Level: Season Rank vs First 20 Games Rank
We next explored how the team standings after 20 regular games compared to the final standings at the end of the regular season. Many teams that performed well in the beginning of the regular season continued to perform well throughout the season (e.g. GSW & DEN), while some teams that were not faring well earlier on finished the season strong (e.g. HOU & UTA), and still other teams that were in the top 8 after 20 regular season games did not make it to the playoffs in the end (e.g. MEM & LAL).
Team-Level: Season Win vs First 20 Games Win
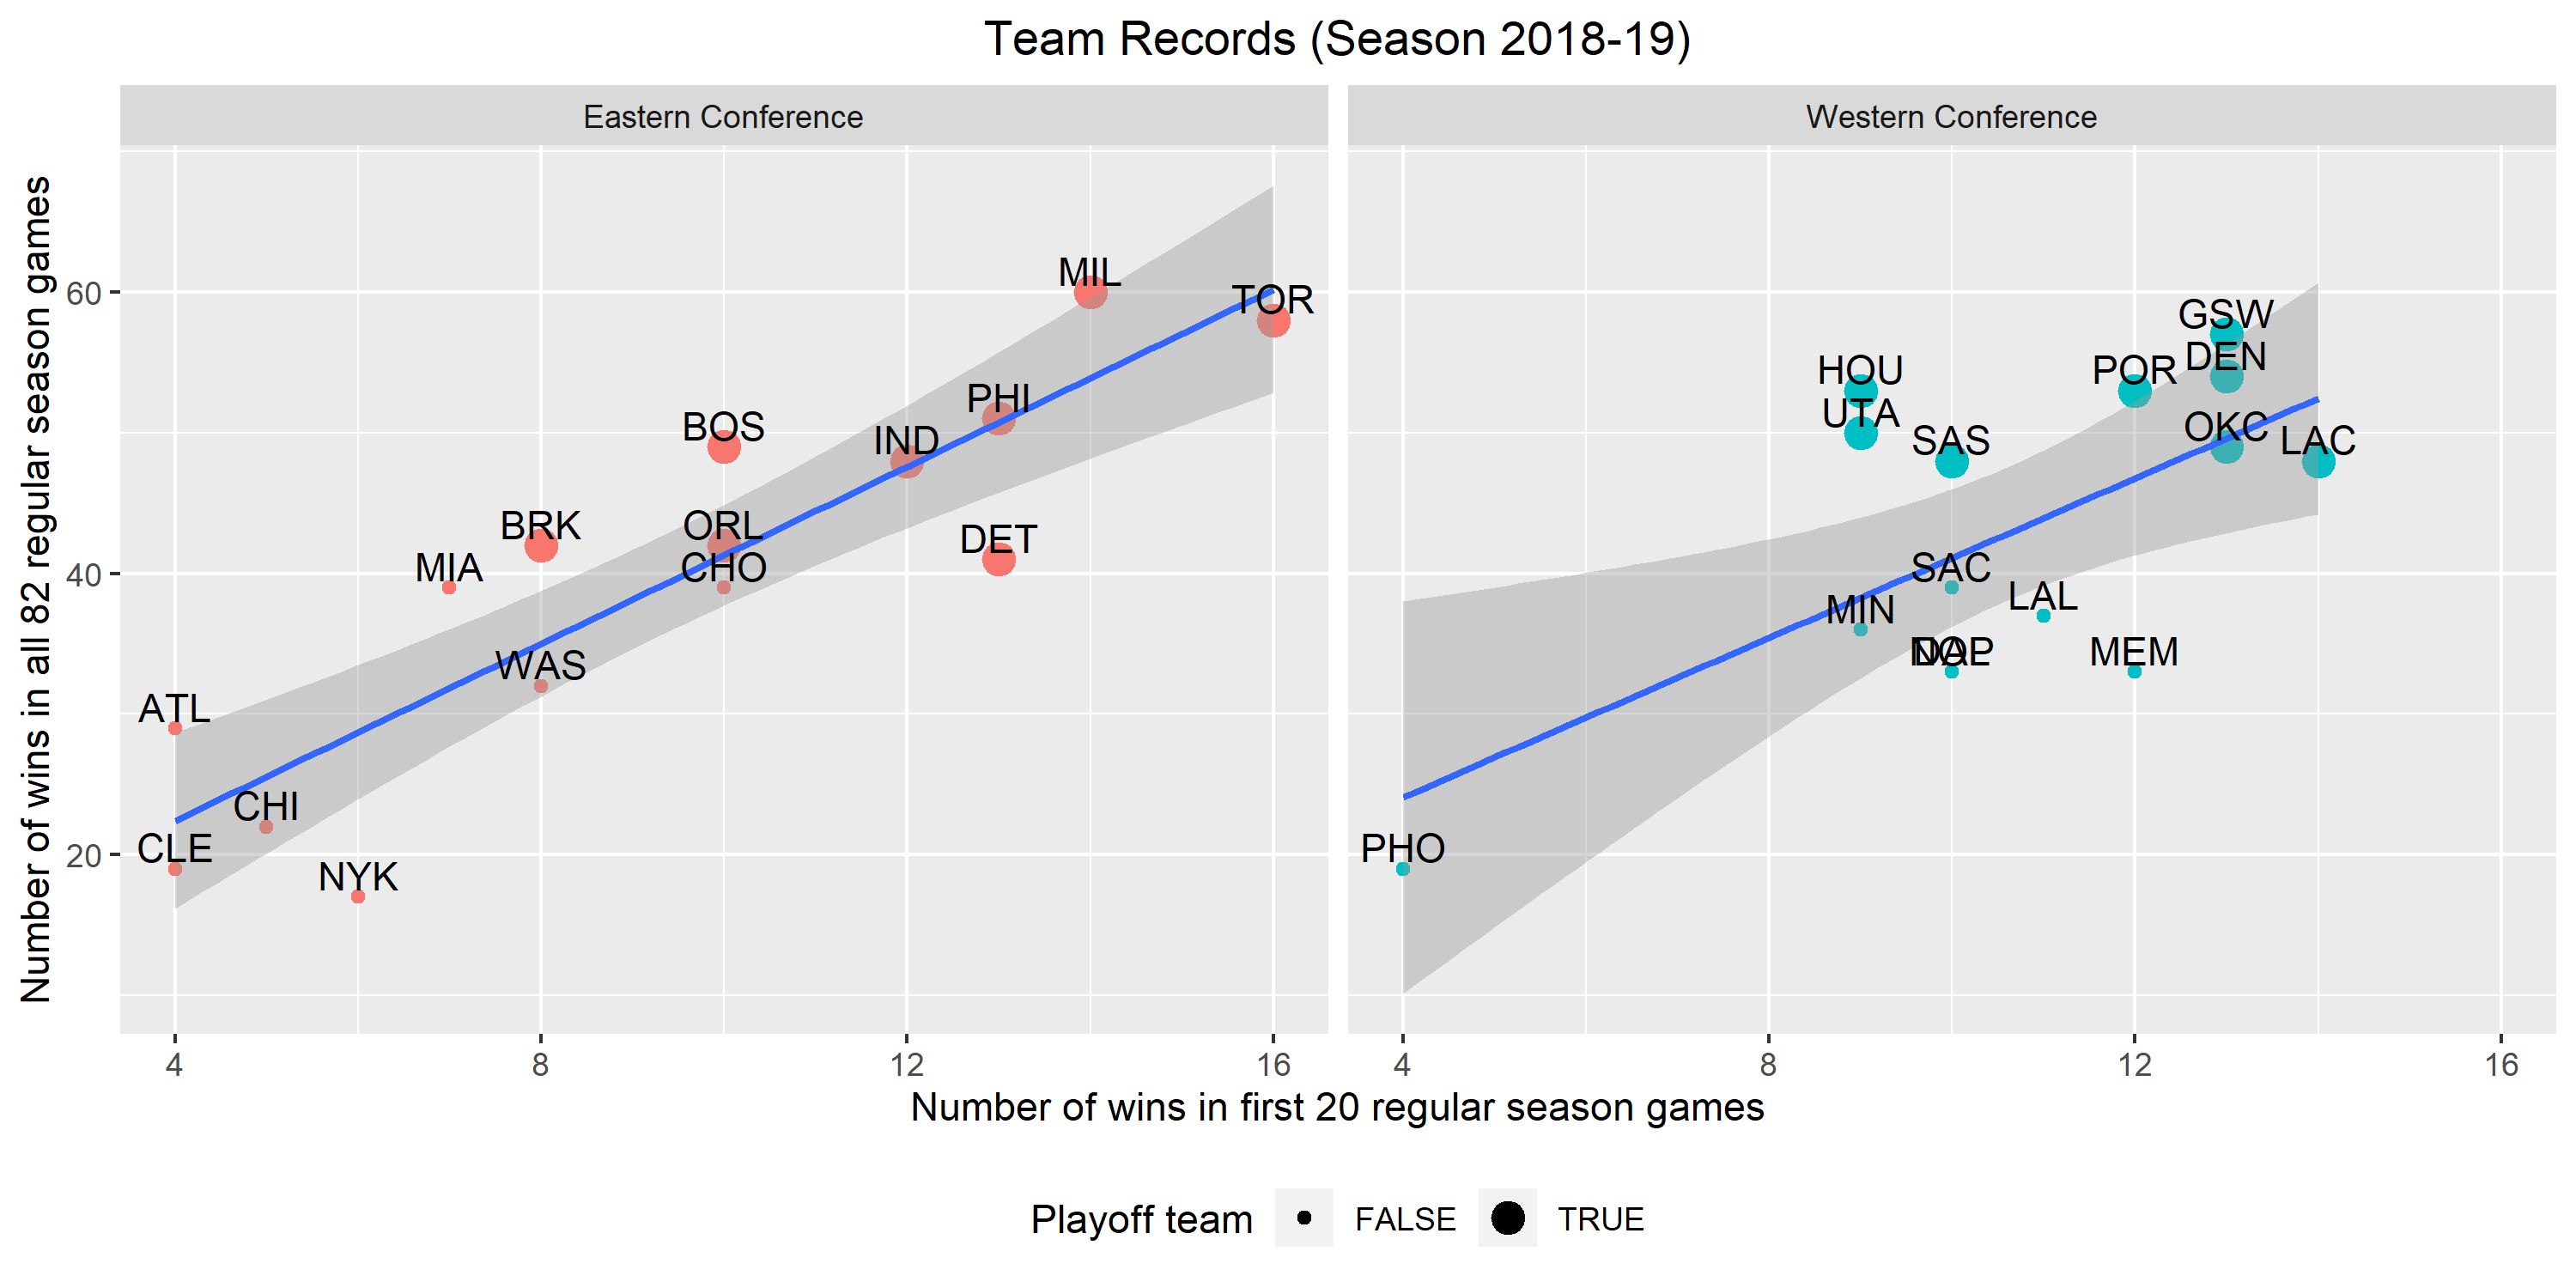
The line shows the expected number of regular season wins if teams were to maintain the same first-20-game-winning-percentage throughout the regular season. Some teams had a consistent performance throughout the season (e.g. MIN & OKC), while other teams had better (e.g. HOU) or worse (e.g. MEM) performance in the remaining 62 games.
Specific Effect: Home-Court Advantage
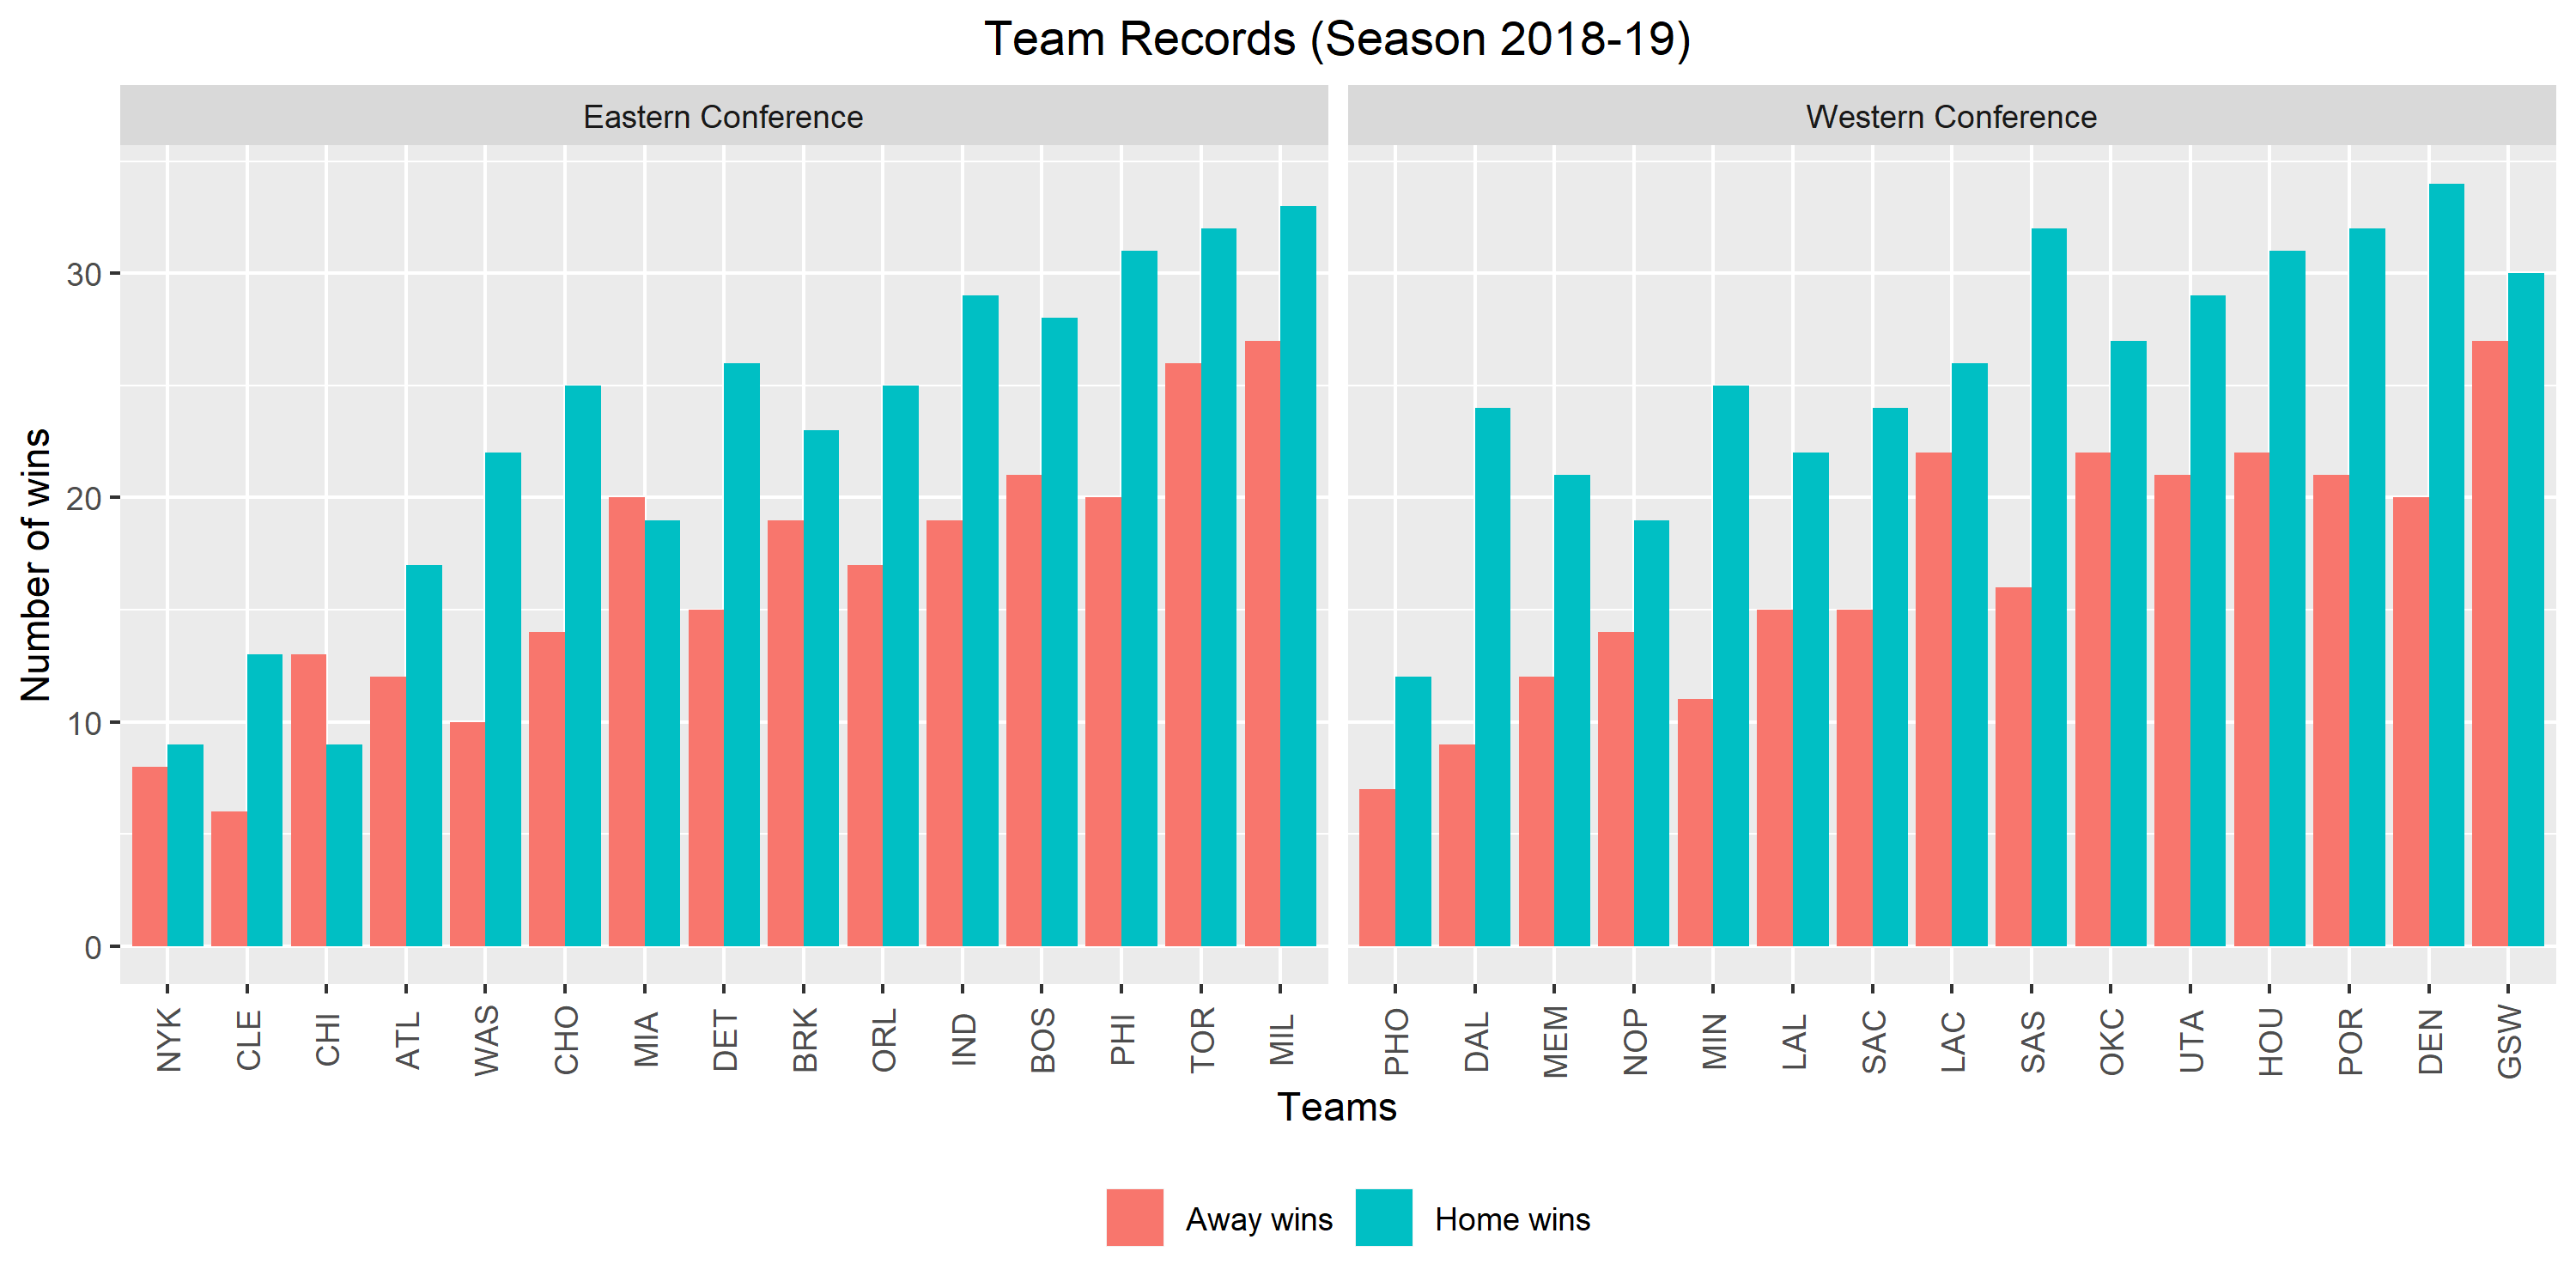
We examined home and away records of teams and could see that most teams have a better record playing at home with a few exceptions (i.e. CHI & MIA).
Specific Effect: Western-Eastern Effect

We examined records of matches where teams from opposing conferences faced each other and could see that more teams from the Western Conference (teams with bars colored green and pink) lie to the right end of the plot, which indicates that these teams have high winning percentages against teams from the opposing conference.
Specific Effect: Winning-Streak Effect
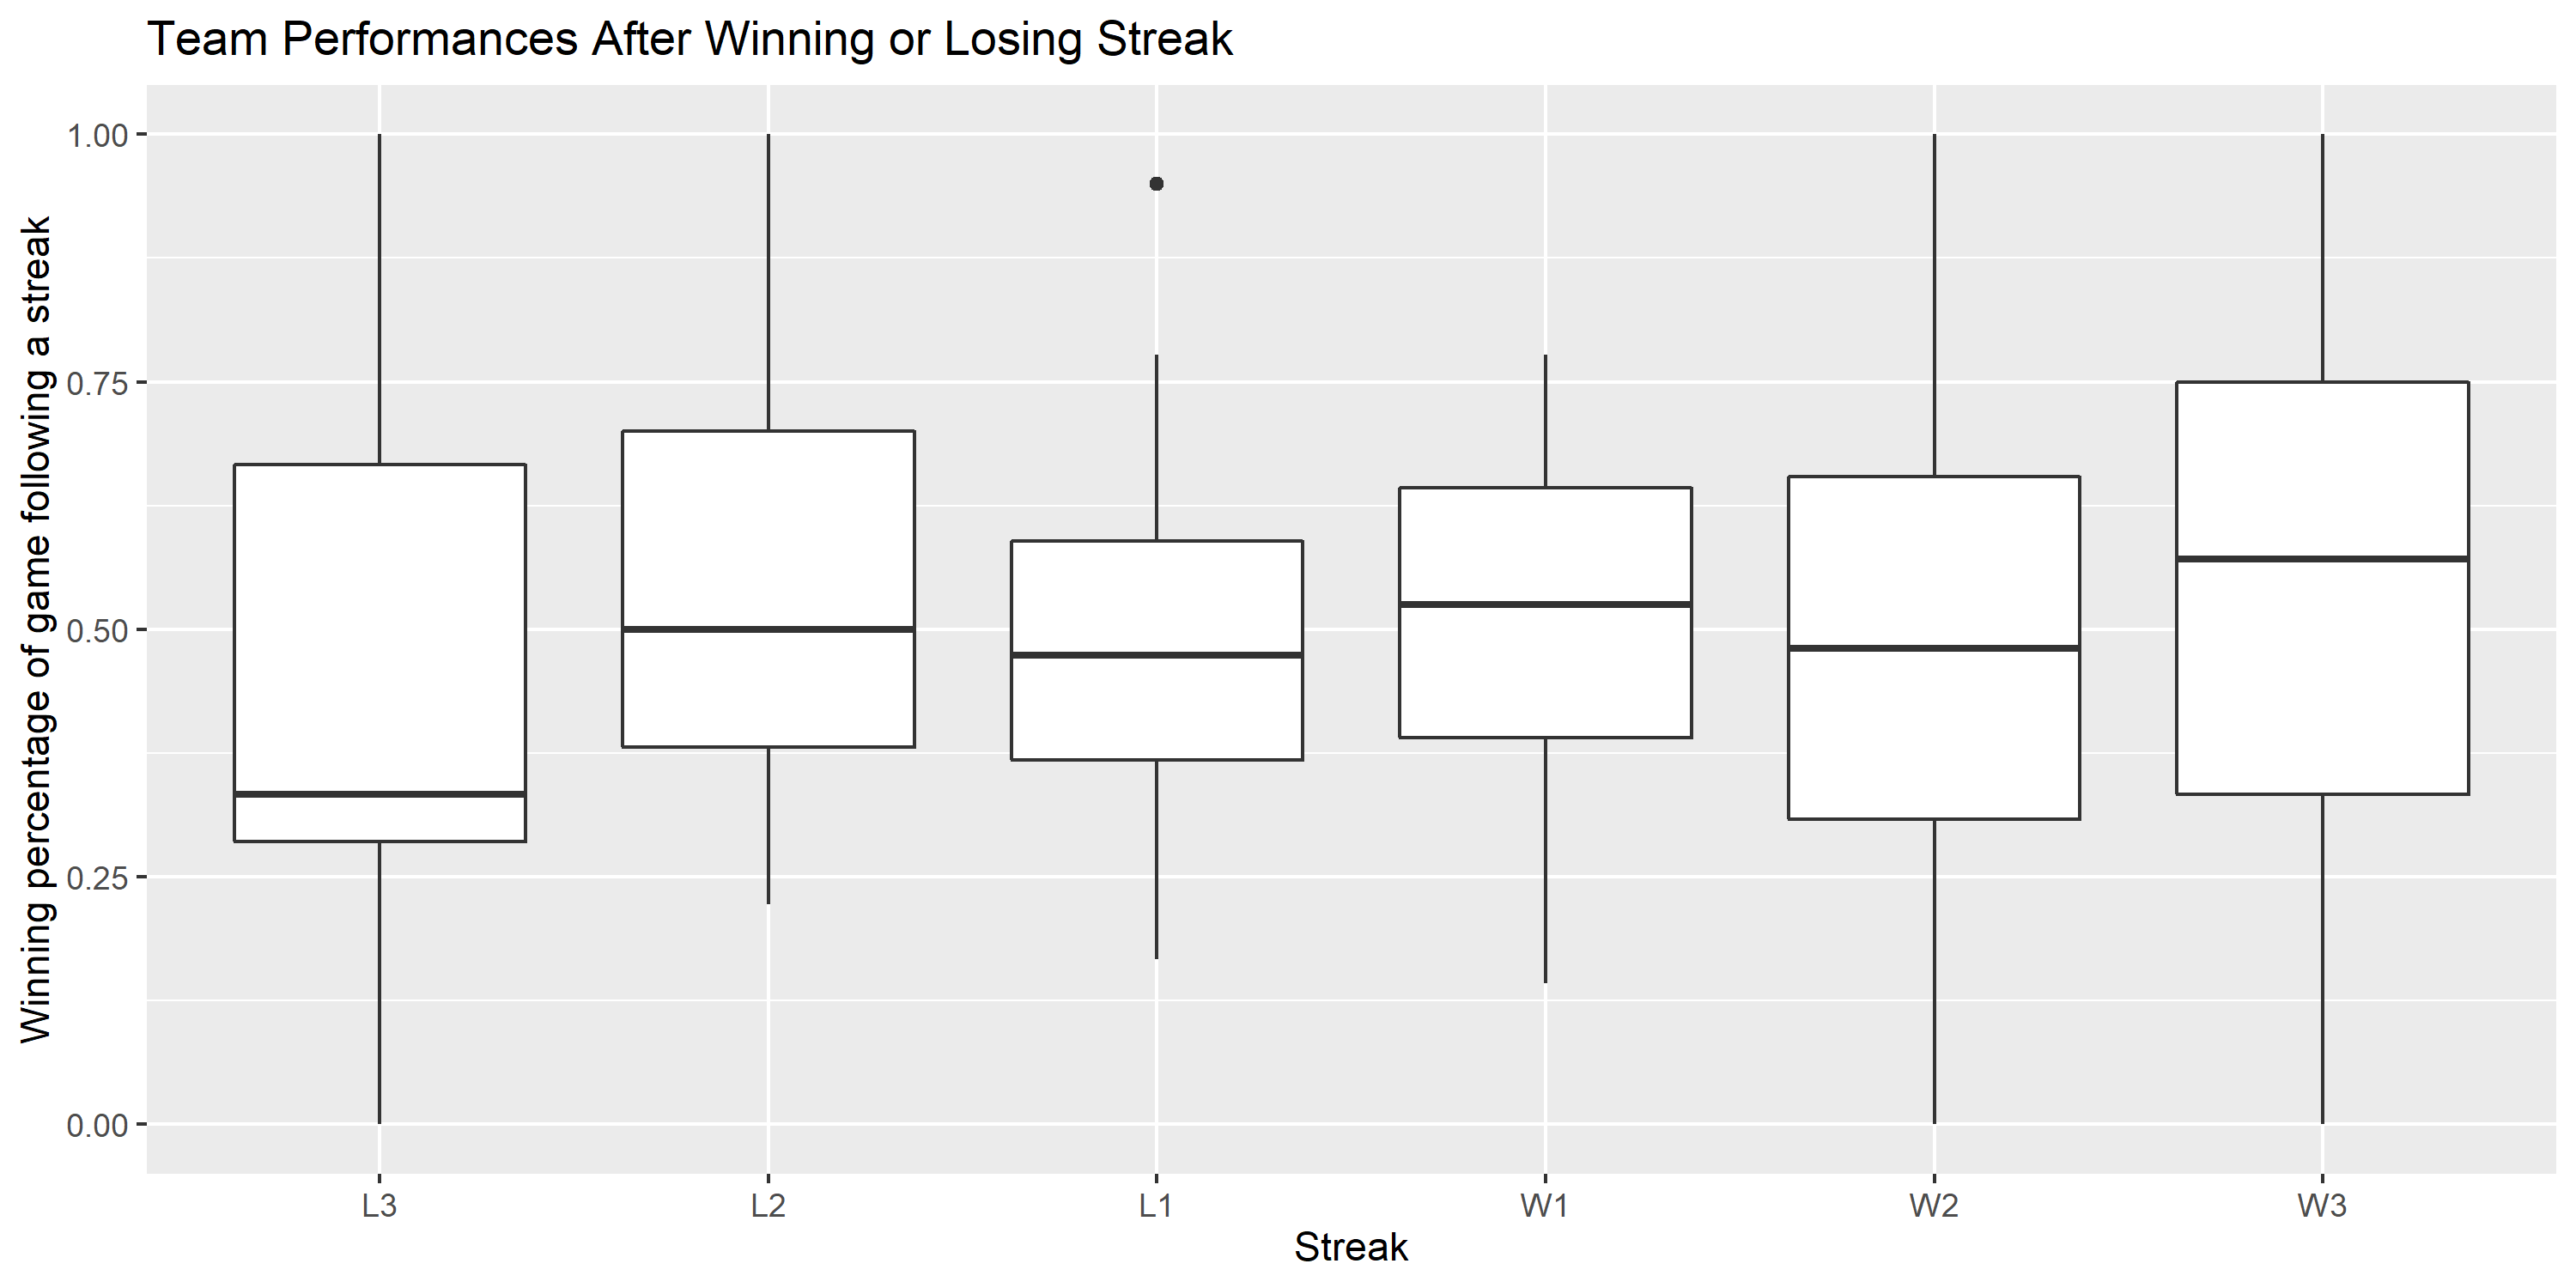
We next considered whether a team’s performance in a game is dependent on the results of the team’s previous games. we looked at match records of teams in the game following win or loss streaks of different lengths. In the 2018-19 season, the longest winning streak was 11 games by the Golden State Warriors and the longest losing streak was 18 games by the New York Knicks. For each team, we applied the Chi-Square test of independence to assess the relationship between streaks and results of the following match. Test results indicated that a statistically significant relationship existed only for the Philadelphia 76ers. A boxplot is used to visualize how the overall performances of all teams in the league vary after different streaks (only winning or losing streaks of up to 3 are shown since other longer streaks are much less common).
Specific Effect: Winning-Streak Effect

We were wondering if teams would perform worse when facing a back-to-back schedule. Using game records from the 2018-19 season, we see that the average proportion of games won by all teams in the league when the game is a back-to-back game is somewhat lower compared to the winning proportion if the teams had extra days to rest. Chi-Square tests of independence indicated that a statistically significant relationship between whether a game was played back-to-back and whether the game was won or lost existed only for the Washington Wizards.
Player-Level: Team Winshare
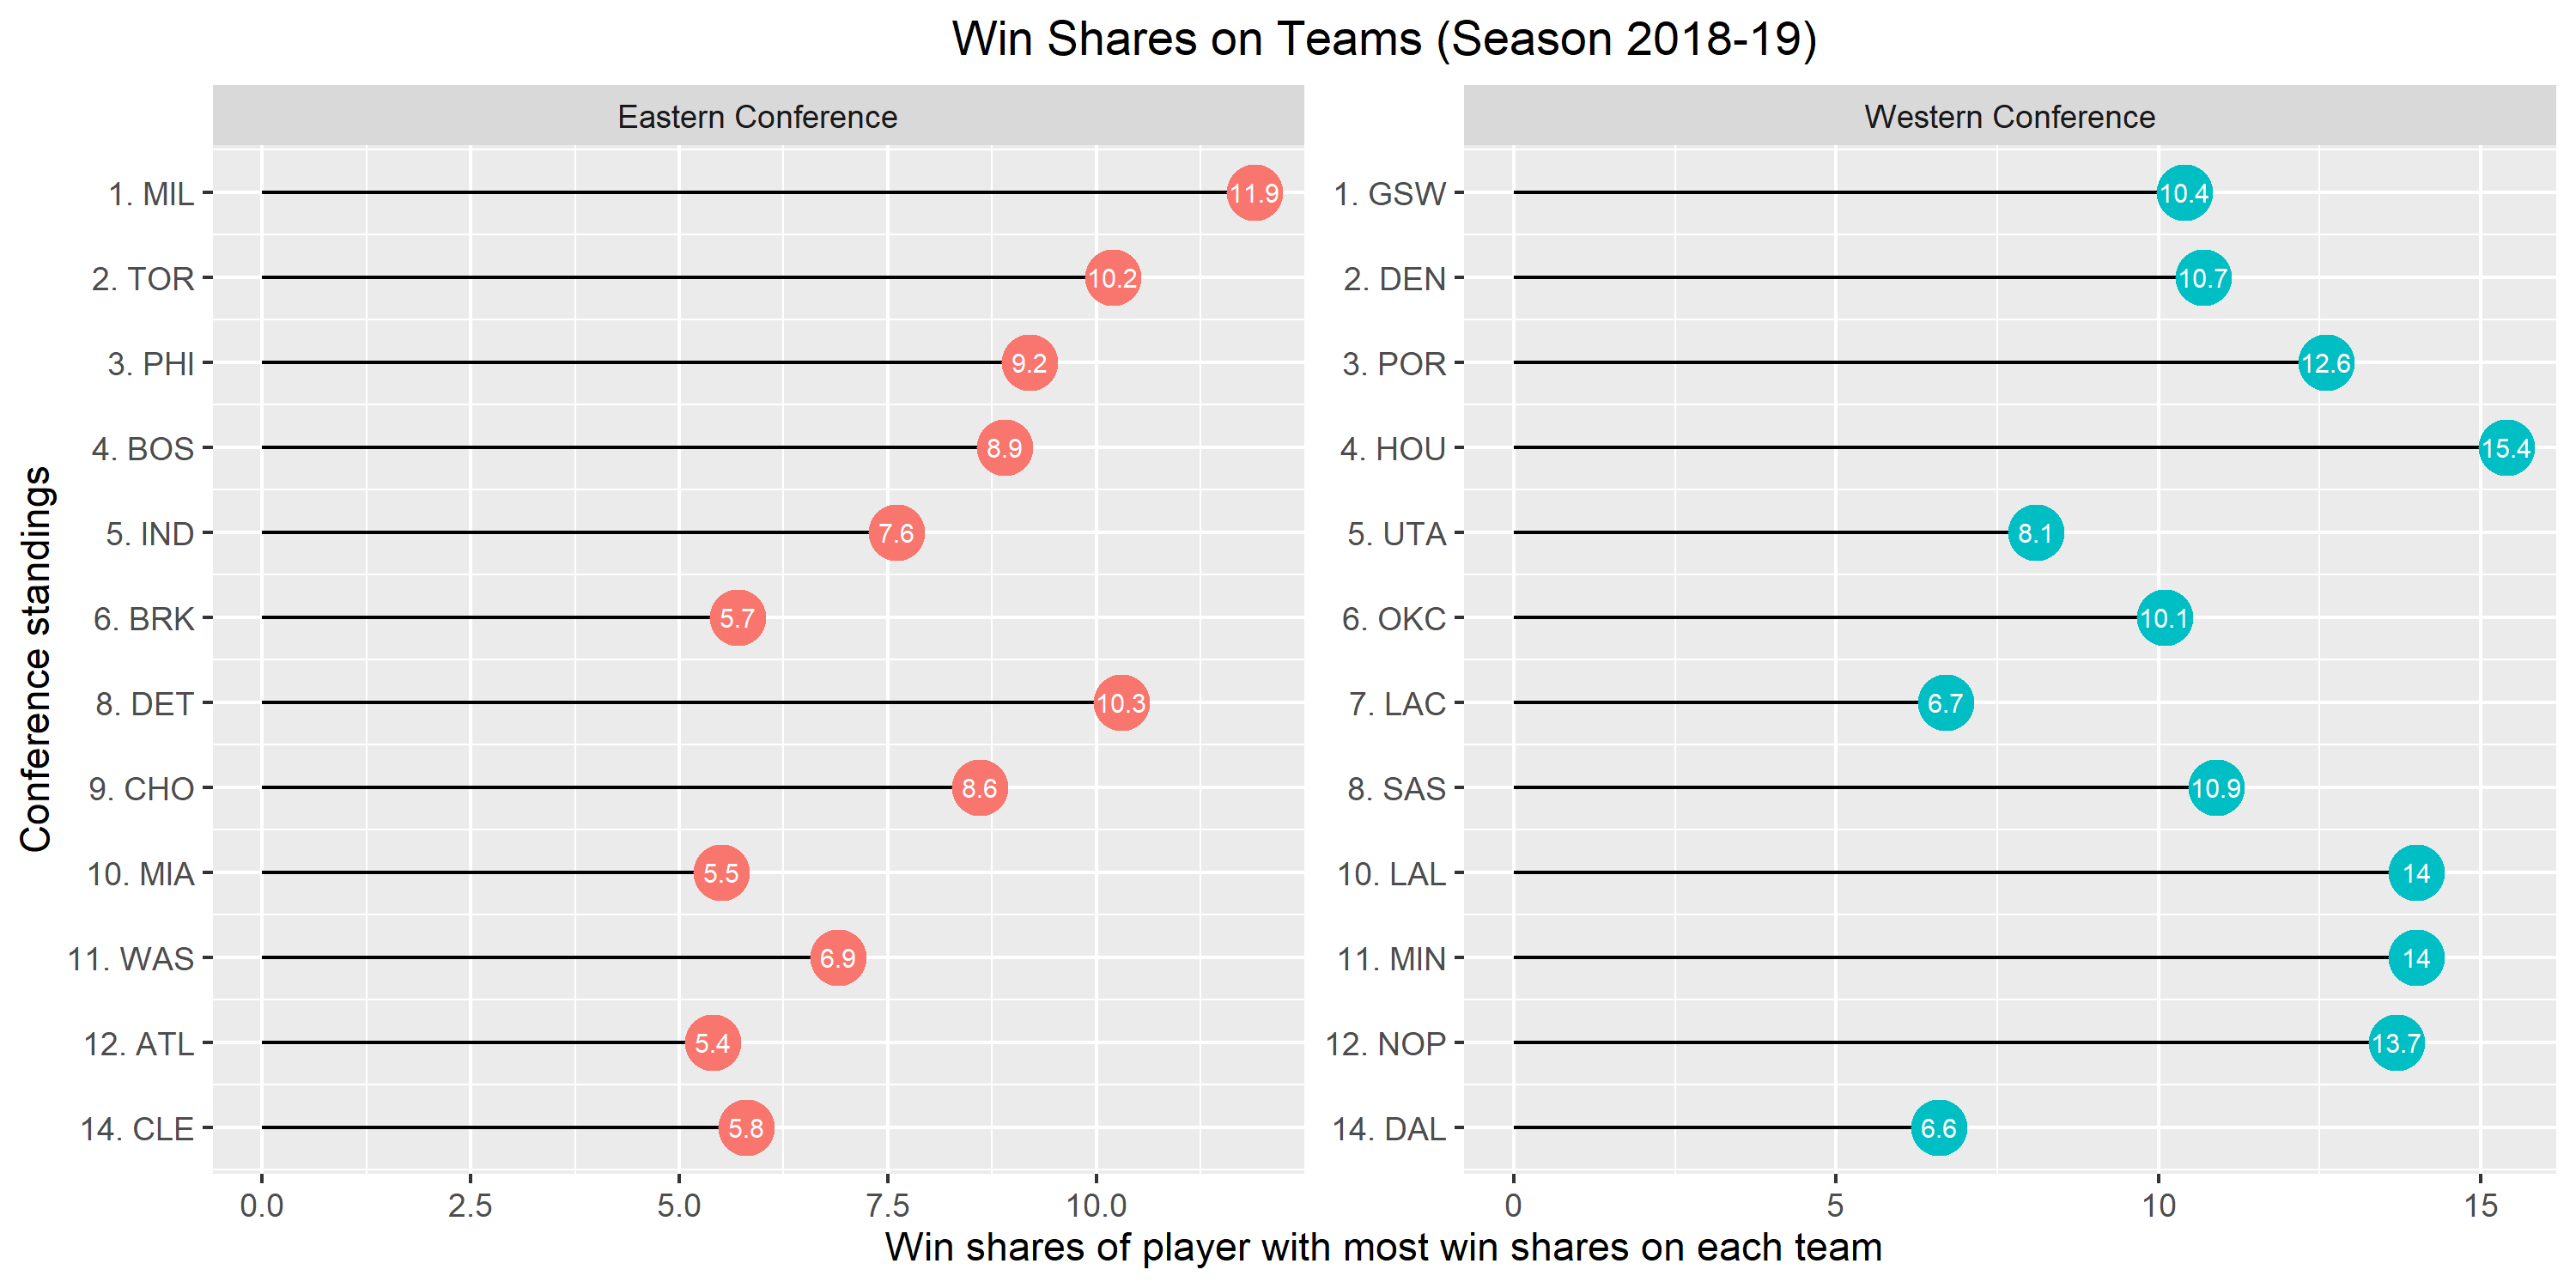
Win shares is a metric that is designed to estimate an individual player’s contribution to the team in terms of wins. We identify the win shares of the player with the most win shares on each team (only considering players with win shares in the top 100 of the league). We can see that teams that have a dominant player tend to perform better.
Player-Level: Player Winshare

We next examine how players’ win shares vary over NBA seasons. We identify the 20 players in the league who have had among the highest single-season win shares during the 2014-15 to 2018-19 season timeframe, and examine how the win shares of these players varied over those five seasons. We see that the win shares of these top players are fairly consistent over seasons.